Accurately predicting which deals will close and how much revenue they will generate is critical for sales teams to effectively manage their pipeline, prioritize efforts, and provide reliable forecasts to leadership. This is where calculating sales probability comes in. In this article, we’ll dive into what sales probability is, compare different calculation methods, discuss key use cases, and recommend an optimal approach.
Table of Contents
What is Sales Probability?
At its core, sales probability is a percentage likelihood that a deal will close, usually based on factors like deal stage, size, age, and salesperson intuition. By assigning probabilities to open opportunities, sales teams aim to quantify their pipeline’s health and projected revenue.
Probabilities allow reps and managers to focus on the right deals at the right time. Opportunities with high probability scores (say 80%+) warrant more attention to help push them over the finish line. Mid-probability deals (around 50%) require further discovery and advancement. Low probability opps (under 25%) raise red flags that deals may not be qualified or likely to convert, especially crucial in the SaaS industry where recurring revenue models dominate.
Rolled up across the entire pipeline, probability-weighted deal values provide an estimate of how much the team is likely to close in a given period. This helps with both bottoms-up forecasting accuracy and setting realistic quotas/expectations.
Methods for Calculating Sales Probability
Organizations use a variety of techniques to determine opportunity probabilities, each with their own pros and cons. Let’s explore a few of the most common approaches:
1. Subjective Assessment
Perhaps the simplest method is to have sales reps enter a subjective probability (usually in increments of 10% or 25%) based on their read of the deal. Reps consider factors like relationship strength, pain points uncovered, budget, timeline, and competition to make an educated guess.
The upside is this is quick and leverages the rep’s frontline knowledge. The big downside is that there’s no standard rubric, so it’s entirely judgment-based. Some reps will be overly optimistic while others are more conservative.
2. Pipeline Stage Probabilities
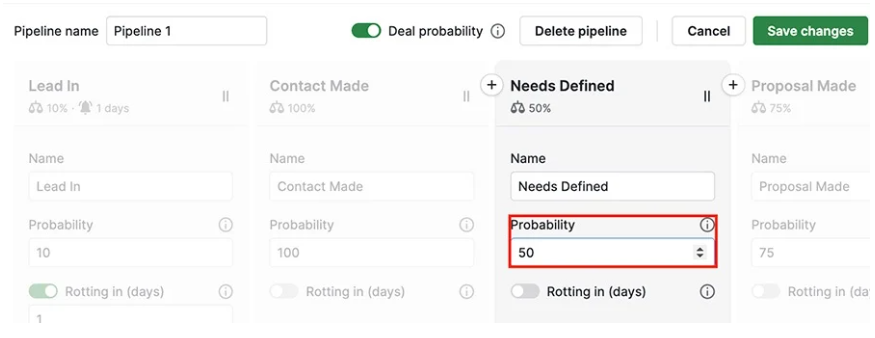
An improvement on pure subjectivity is to use deal stage as a proxy for probability. Most CRMs like Salesforce & Pipedrive have default probability values assigned to each stage.
For example:
- Lead In: 10%
- Contact Made: 20%
- Needs Defined: 50%
- Proposal Made: 75%
- Negotiation: 90%
- Closed Won: 100%
The theory is that deals in later stages are more likely to close. This provides a standard framework across the team. However, it assumes all deals within a stage have equal likelihood, which doesn’t account for deal-specific nuances.
3. Historical Data-Driven
Some organizations calculate probabilities based on their historical close rates. They’ll analyze past deals to determine the percentage that closed/won from each stage.
For instance, if over the last year 253 out of 500 deals (50.6%) in the Proposal stage ultimately closed won, new deals in that stage inherit that 51% probability.
This has the advantage of being highly data-driven and objective. But it requires robust sales data, which newer companies or products may lack. It also doesn’t account for recent market shifts that alter historical patterns.
4. Weighted, Multi-Factor Approach
The most sophisticated approach is to consider multiple deal variables and weight their impact on probability. This could include:
- Deal size
- Age (days in pipeline)
- Product fit/use case
- Decision-making process
- Procurement involvement
- Competitive landscape
- Compelling event driving urgency
Managers work with reps to score each factor and the CRM calculates an overall probability. While thorough, this is time-consuming and still ultimately requires human input and interpretation.
5. The WWW & WIH Method (Recommended Approach)
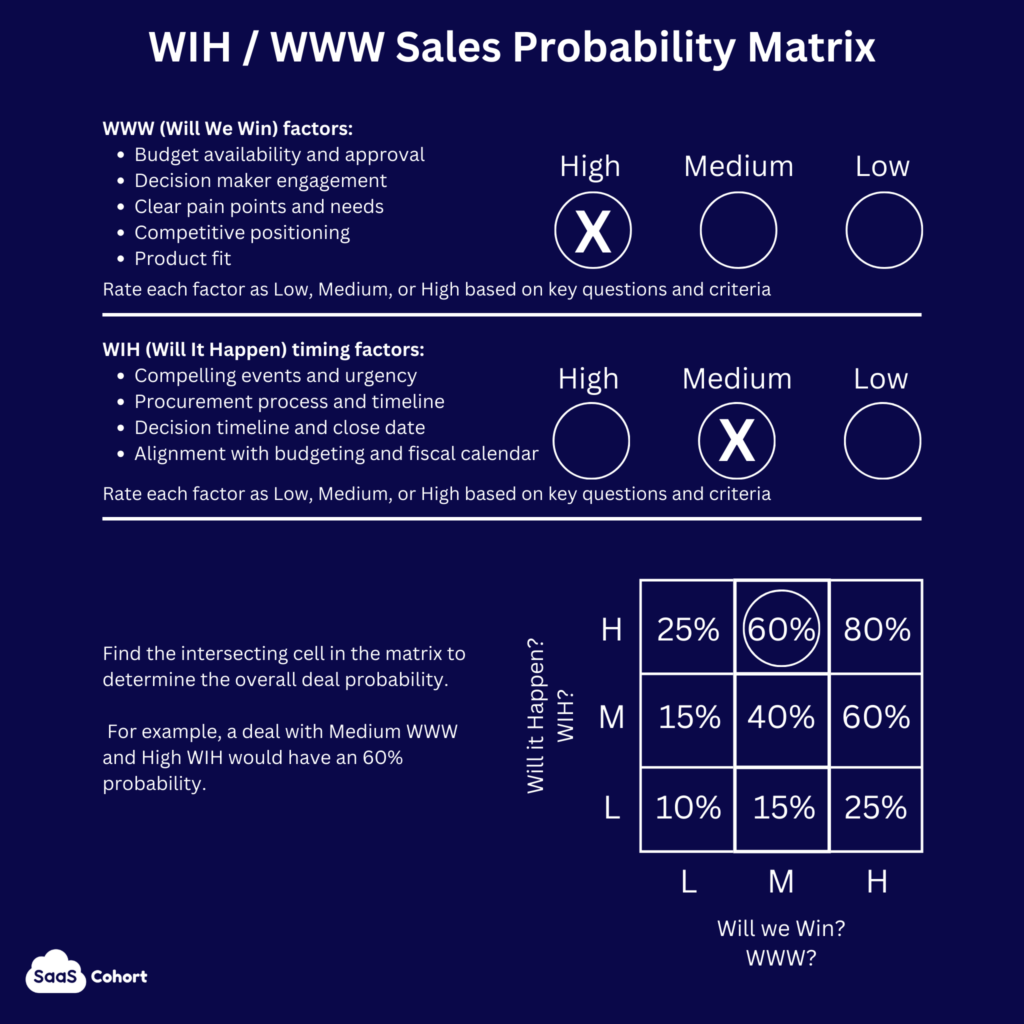
- (WWW) Will We Win? (Low, Medium High)
- (WIH) Will It Happen This Period? (WWW) (Low, Medium, High)
The WWW question reflects the deal’s overall probability of closing based on positive/negative indicators like champion, budget approval, decision process, competitive threat, etc.
The WIH question adds a time-based factor – how likely is it to happen this month/quarter? This reflects compelling event, expressed urgency, seasonal budget cycles, etc.
Based on a deal’s answers to each question, it maps to one of 6 probability scores between 10% to 80%.
For example, High WWW + Medium WIH = 60% probability.
This approach has several advantages:
- Intuitive for reps to grasp and use
- Can be standardized across team
- Reflects both overall and time-based probability
- Enables more granular forecasting
- More predictive than single-factor approach
To implement, train the team on how to evaluate WWW and WIH using concrete examples they encounter regularly. Build the matrix into your CRM. Inspect WWW/WIH regularly in pipeline reviews to norm scoring.
Key Use Cases for Sales Probability
With those methods in mind, where is sales probability most impactful? Here are some of the top applications:
1. Weekly Pipeline Reviews & 1:1s
In weekly team pipeline discussions and manager-rep 1:1s, probability helps identify which deals need attention. Managers can coach reps on how to advance high-potential deals while flagging at-risk deals. Probability adds an objective measure to deal reviews.
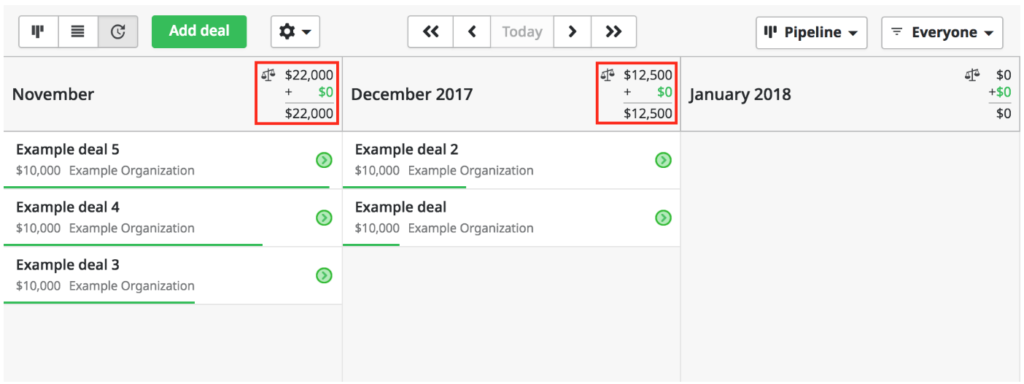
2. Pipeline Snapshots & Revenue Projections
Rolling up probability-adjusted pipeline values provides a forecast of revenue likely to close in a given month/quarter. Sales leadership relies on this for Board-level projections, setting quotas and budgets, and headcount planning.
At an individual rep level, pipeline snapshots show if someone has enough high-probability deals to hit quota. Managers can proactively help reps fill gaps before it’s too late.
3. Deal Prioritization & Resource Allocation
Sales reps have to ruthlessly prioritize their time. Probability helps them zero in on the opportunities most likely to convert so they focus their efforts accordingly.
A deal with an 80% probability score should command more attention than one at 20%. The higher the probability and deal size, the more resources (like SC involvement, exec sponsorship, etc.) should be deployed.
4. Bottoms-Up Forecasting
Leadership needs an accurate revenue forecast to make informed investment decisions and guide the company’s overall direction. Probability-based bottoms-up forecasting lets managers roll up commit, upside, and pipeline values.
By categorizing deals by likelihood of closing – like commit (80%+), upside (50-80%), and pipeline (under 50%) – and summing the probability-weighted values, managers can project revenue within an acceptable range.
The Role of Closing Dates in Probability
A key component that goes hand-in-hand with probability is anticipated closing date. After all, a deal with a 90% probability is only valuable for this month’s forecast if it’s actually expected to close in the next 30 days.
Sales teams need to be rigorous about maintaining realistic close dates. Reps should only advance close dates with clear proof of timeline (RFP deadlines, expiring contracts, budgets, etc.), not just hope.
Managers should review close dates just as closely as probabilities during pipeline reviews. Holding deals in months where they’re unlikely to close leads to inaccurate forecasts.
Best practice is to run an “Opportunities by Close Date” report regularly to identify opps with close dates in the past. Reps should update stale opps to reflect a real close date or move to Closed Lost if past due without clear reengagement.
To forecast revenue in a given month/quarter, multiply the deal value by both its probability and a 1 or 0 for if its close date falls within that time period. Sum up those probability-weighted values for a projection.
In summary, calculating sales probability is a crucial piece of the puzzle for deal prioritization, forecasting accuracy, and ultimately revenue predictability. While there are several methods, each with merits, this article recommends the WWW/WIH approach as a “best of both worlds” option.
By considering both a deal’s overall odds and its likelihood of closing this period, the WWW/WIH framework enables a structured yet flexible way to forecast revenue. Implemented well, it empowers teams to focus energy on the right deals to hit goals.
The key is to make sales probability a core part of your team’s operating cadence. Build it into your CRM, pipeline reviews, and 1:1s.